Step 2: Inspecting sequence data quality
There are a set of analyses that can be carried out directly on a FASTQ file to assess the quality
of sequencing. These include looking for poor quality data, looking for read duplication, assessing
GC content, looking for over-represented sequences and the presence of sequence adapters in reads.
Luckily there are also well-established tools that make running these analyses easy. The one we'll
try is called fastqc.
Overview of fastqc
The summary below is taken from the fastqc webpage
"Modern high throughput sequencers can generate hundreds of millions of sequences in a single run. Before analysing this sequence to draw biological conclusions you should always perform some simple quality control checks to ensure that the raw data looks good and there are no problems or biases in your data which may affect how you can usefully use it.
Most sequencers will generate a QC report as part of their analysis pipeline, but this is usually only focused on identifying problems which were generated by the sequencer itself. FastQC aims to provide a QC report which can spot problems which originate either in the sequencer or in the starting library material.
Running fastqc
To get a sense of the quality of this data, let's run fastqc now on the human data.
First make a directory for the output and run fastqc:
mkdir fastqc_output
fastqc -o fastqc_output human/*.fastq.gz
You should see something like this:
fastqc -o fastqc_output human/*.fastq.gz
Started analysis of NA12878-read1.fastq.gz
Approx 5% complete for NA12878-read1.fastq.gz
Approx 10% complete for NA12878-read1.fastq.gz
Approx 15% complete for NA12878-read1.fastq.gz
...
This will process both reads and will take a couple of minutes to run.
If you look in the fastqc_output folder now you'll see there are some new files:
$ ls fastq_output
NA12878-read1.fastq.zip
NA12878-read1.fastq.html
NA12878-read2.fastq.zip
NA12878-read2.fastq.html
...
fastqc has created some .html files, as well as some .zip files. Look at these by opening the
.html files in a web browser.
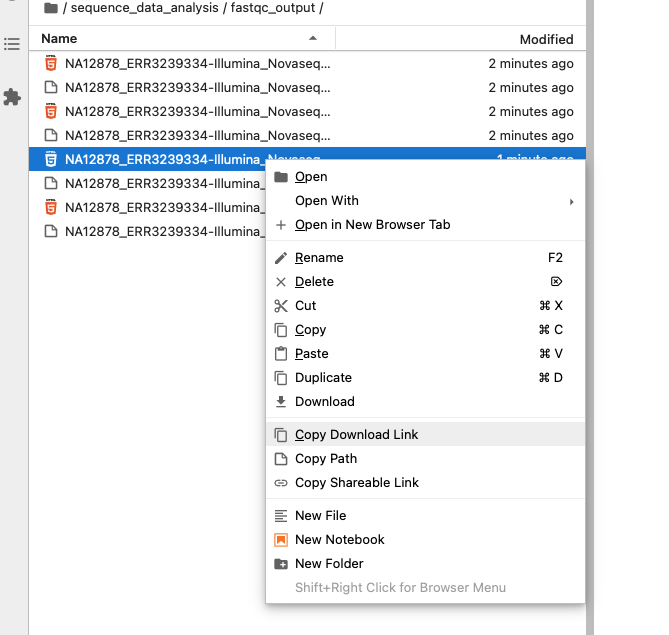
If you've run this on JupyterHub, the best way to view the output will be to download the .html file to your computer. Find the file in the file browser on the left, right-click and choose 'Download':
Then double-click on the file to open in your web browser.
Make sure to look at results for both read 1 and read 2. Here are some questions to answer:
What is the GC content of the reads? Is this what you'd expect from the human genome? (For example, you made a plot of GC content in the introduction to R. Is this value similar to the GC percentage of chromosome 19?).
Is the base composition similar all the way along the reads?
What about base qualities - are these equally good near the start to the end of the read? And are they equally good across both reads?
Tip The data we are looking at is pretty good quality - so the differences you see will be quite subtle. We've got some more dramatic examples of things that go wrong below.
What can go wrong?
Not all Illumina sequence data is as good quality as this data. Here are some examples of FastQC outputs for other Illumina datasets that show a variety of problems. For each example we've linked to a relevant section of the report, but feel free to look at other sections too. (The icons in the menu on the left can indicate where FastQC thinks there might be problems.) Feel free to discuss with the person next to you / your group.
An example where the data seems to have low quality, possibly because the flowcell has bad tiles. If you click on 'Sequence duplication levels' and 'Overrepresented sequences', you'll see this data also shows high rates of read duplication and PCR adapter contamination. This could be a sign of low input to the library preparation step, so that the same fragment gets amplified and sequenced multiple times.
A human sample sequenced on a Novaseq at the CHG, for which read 2 is enriched for poly-G sequences. Try clicking on the Per-sequence GC content and 'Overrepresented sequences' plots to see this. This could mean that the cluster formation on the flowcell didn't work well for the 2nd read, for some reason. (This data also has a different way of compressing base qualities, so they look a bit different to those in the data we processed above.)
Another version of NA12878 sequencing, sequenced during a fragmentation testing process, that has the same problem but even worse.
A (non-human) sample sequenced on the Illumina XTEN where the reads have PCR primer contamination from the library prep step.
Take-home messages
As you can see from these examples, many artifacts can arise in sequence data either due to issues in the DNA 'library' preparation or during the sequencing itself. The point of doing QC is to check for and diagnose any problems before proceeding with analysis.
Some key points are:
Results do depend quite a bit on the specific sequencing platform, and how it is run! It can differ from platform to platform - and to some extent, from sample to sample.
Artifacts can arise from sequencing problems themselves (e.g. bad flowcells or failed cluster generation on the flowcell) but can also arise from things like amplification artifacts during library preparation.
Base qualities typically start high but decrease over the length of the read. (In some data they're lower right at the start as well). It is also typical for them to be slightly lower for read 2 than read 1.
Duplicate reads (i.e. sequencing of the same original fragment more than once) can arise due to problems in amplification. (This is something we will handle in analysis to avoid analysing the same data twice.)
All the data we've looked at above is from Illumina paired-end sequencing. However, for comparison, here is an example of a long-read human dataset (PacBio Hifi) - this looks quite different!
Next step
When you're ready to move on, continue the practical (go on to step 3).